

Economic Snapshot – June 2026
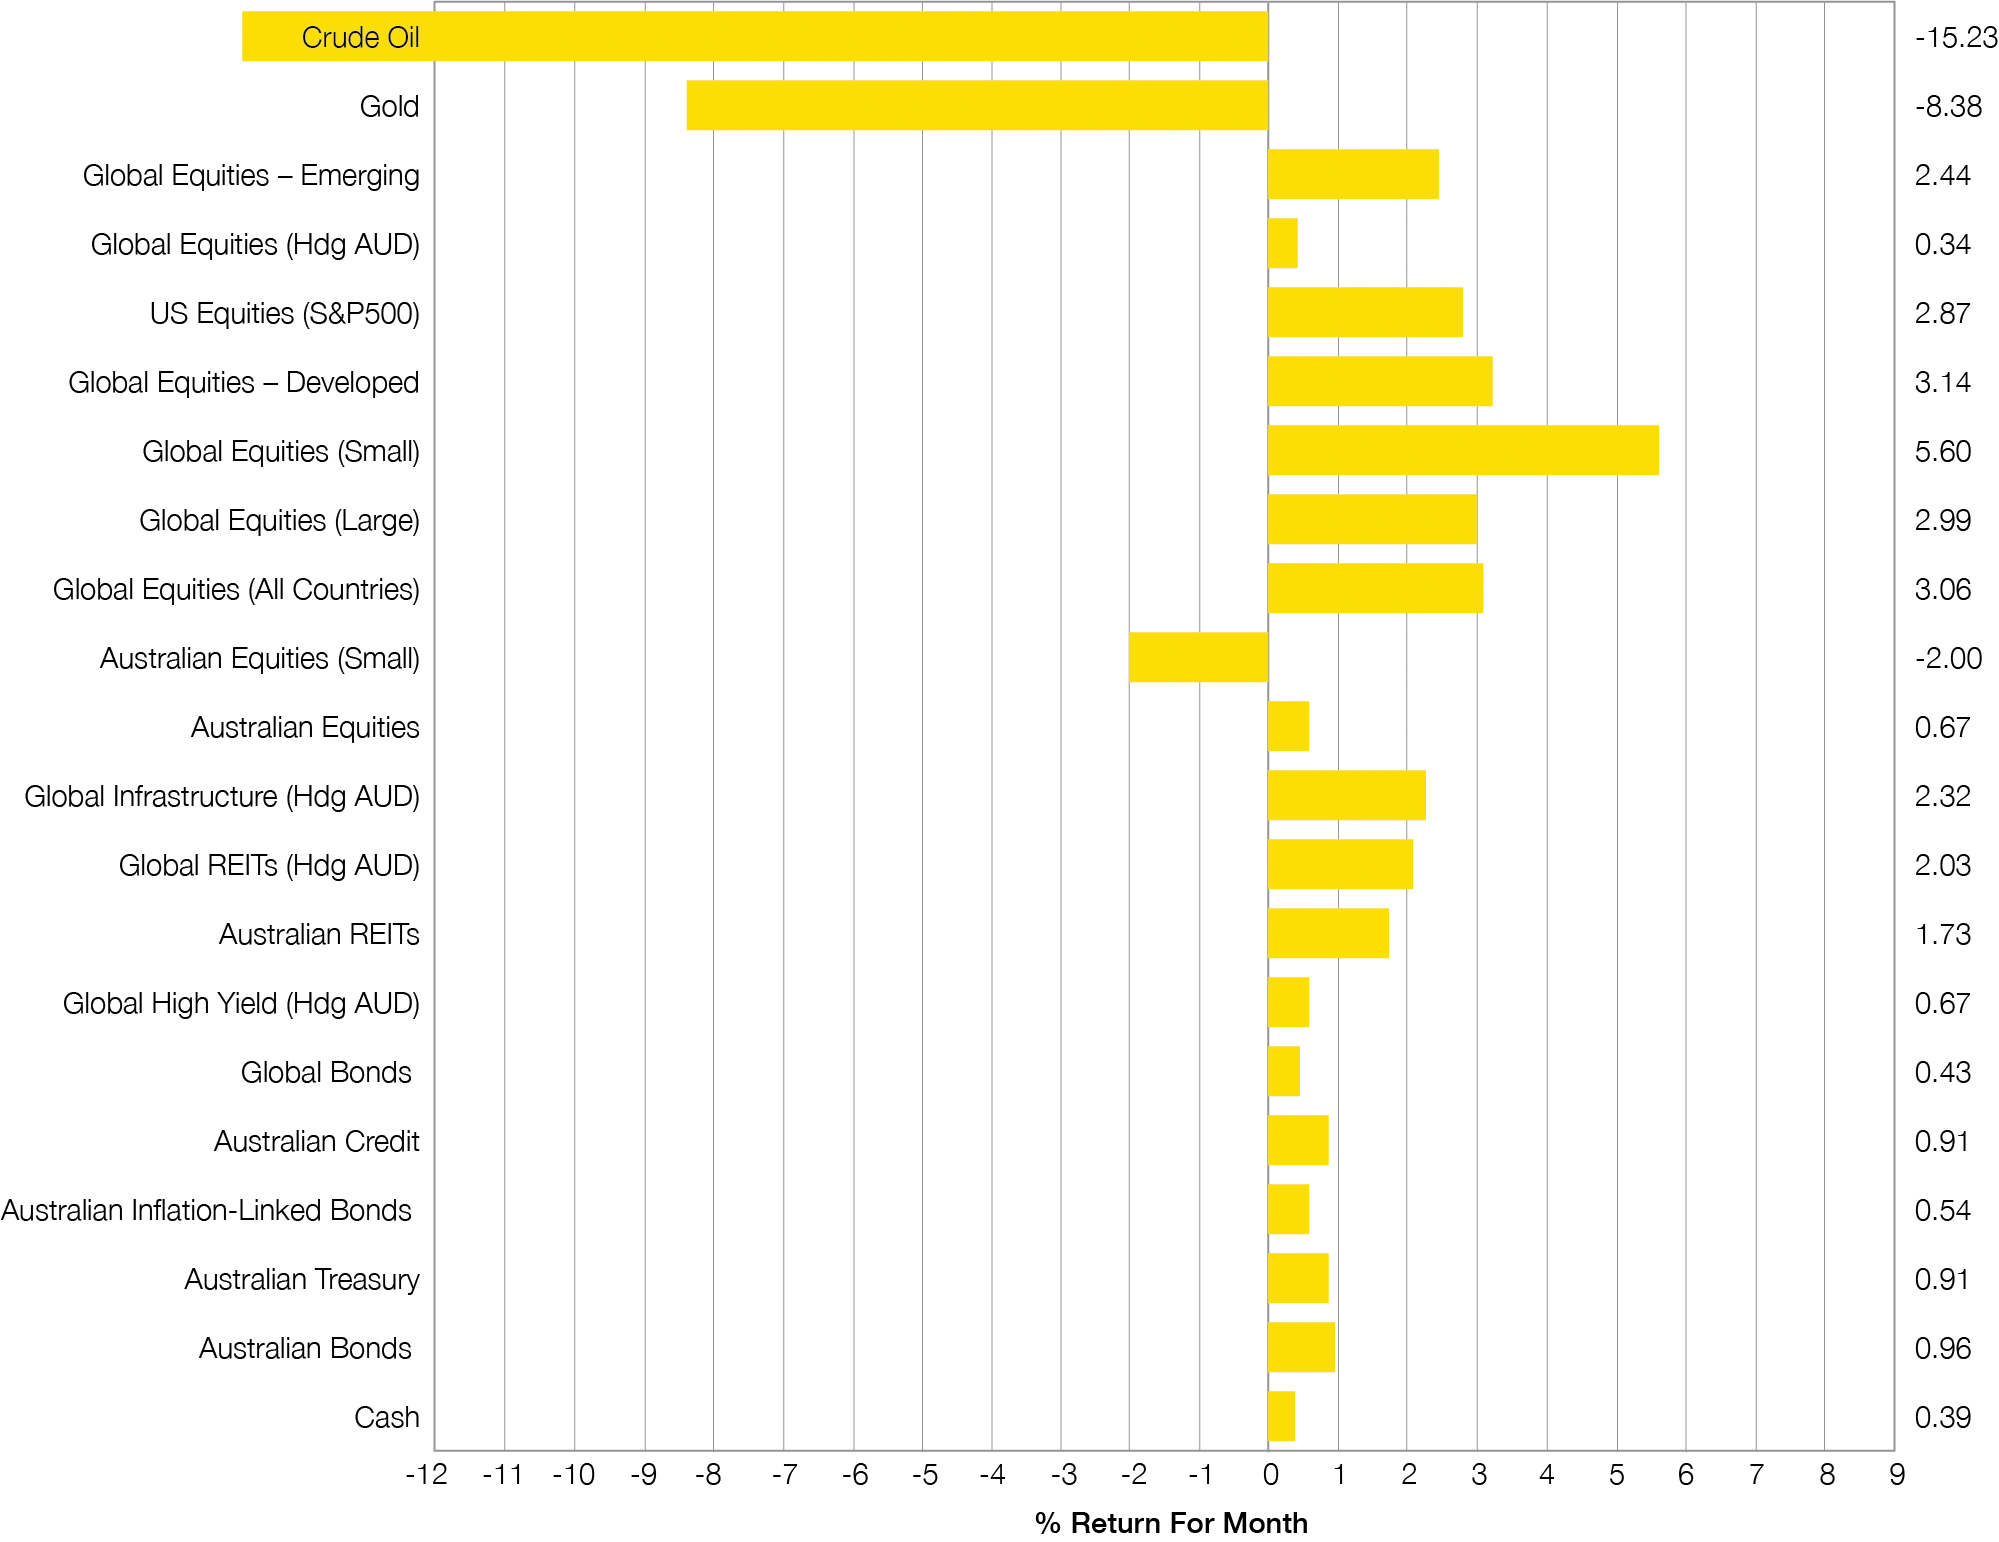
Whilst the global economic growth expectations have been revised down by major economic agencies, most sharemarkets have soldiered on producing solid returns for June. Strength came from Global Small Companies, but the small Australian Companies have lagged as technology-related stocks have been the big performers.

This June economic snapshot article is prepared by Michael Furey, Principal of Delta Research & Advisory, on behalf of the HPartners Group.
Summary
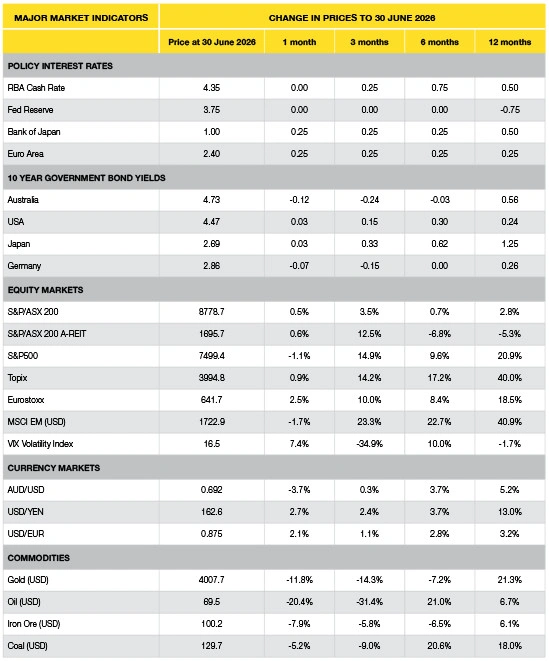
- The oil price is down but other ongoing effects from the Iran War are not, as the higher energy prices increase inflation, placing upward pressure on interest rates. This has increase bond yields making them a little more attractive as the probabilities of lower cash rates around the world has dissipated.
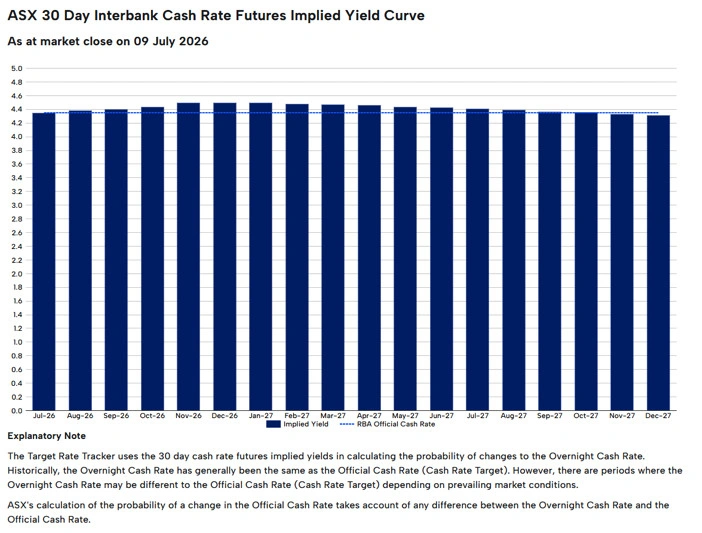
- In Australia, interest rate expectations are potentially one more rate rise, but economic growth weakness has resulted in markets less confident of a rise with probabilities pointing to an equal chance of cash rates staying at 4.35%. Overseas, the higher inflation resulted in rate rises by the European Central Bank and Bank of Japan, but this has placed their cash rates at a still low 2.4% and 1%, respectively.
- Whilst the global economic growth expectations have been revised down by major economic agencies, most sharemarkets have soldiered on producing solid returns for June. Strength came from Global Small Companies, but the small Australian Companies have lagged as technology-related stocks have been the big performers.
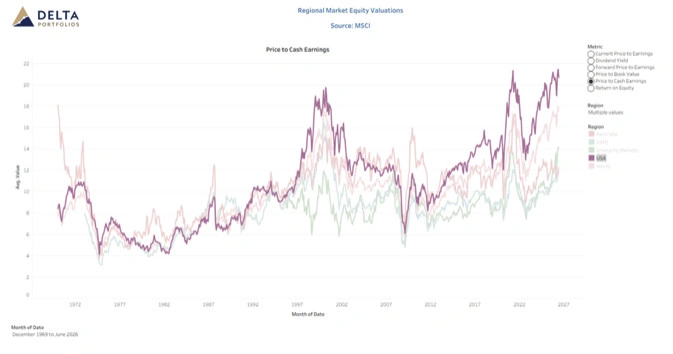
- Our core investment message remains despite persistent downside risks from high sharemarket valuation in USA and the energy crisis. This means disciplined risk management rather than aggressive positioning changes. Shares continue to offer an attractive risk premium in specific markets, as do conservative bonds, but returns may be challenged from occasional short term volatility. Avoiding panic (selling) decisions continues to be a crucial investment issue today for long-term investors.
Chart 1
Global Small Companies outperform for a change!
What Happened Last Month?
Markets & Economy
- The key economic issue during June continued to be the rising inflation around the world, whether Australia, USA, Europe or Asia. The higher inflation is resulting in global economic growth downgraded for 2026 and this appears to be consensus for the Australian economy too – i.e. weaker economic growth than previously expected.
- Despite this bleak economic situation, markets generally advanced as they were supported by solid corporate earnings and ongoing capital spending on artificial intelligence. Global smaller companies outperformed larger companies (which seems rare in recent times), but the strong returns were somewhat broad across Europe, USA, and Japan. Unfortunately, Australian smaller companies were under-performers returning negative 2% in June.
- Bond yields steadied a little resulting in solid returns during June and with high equity market valuations from the USA, and many fixed interest markets yielding over 6%pa, fixed interest does appear relatively attractive.
- In Australia, there was no interest rate increase by the RBA but markets still have the potential of one more rate rise for 2026 priced in, so inflation and economic outcomes will likely be the determinant. High inflation means a rate rise, whilst a weak economy means it will probably be unchanged. Unfortunately, neither outcome appears particularly positive.
- Whilst unemployment continues to appear very healthy around the world, the forecast weaker economy may mean a slight increase, but markets appear to be marching to a different beat – and that beat has been momentum, where the strong keep being strong.
Outlook
- As mentioned, markets are pricing in the potential of one more interest rate rise by the Reserve Bank of Australia in 2026 although this likelihood reduced during June.
- Bond yields are only a little higher suggesting economic growth is likely to be positive but strongly so.
- US markets continue to be near record high valuations and are generally forecast to be weaker than non-USA sharemarkets over the next 10 years. This doesn’t mean any imminent crash is likely, but caution should always be appropriate with expensive markets.y.
- We continue to believe portfolios should be underweight USA shares and high yield (junk) bonds due to these near record high valuations. Markets continue to price in potentially higher cash rates for Australia (~4.5% by the end of 2026), but conservative bond portfolios both global and in Australia, are providing strong expected returns over 5%pa.
- Our current beliefs are that new investors should dollar cost average into sharemarkets and long-term investors should stay invested for the long-term but expect and get used to higher volatility.
- Diversification continues to be essential. Maintaining a balance between domestic and global exposures remains a prudent approach as 2026 unfolds. Rebalancing as pricing opportunities arise also continues to be appropriate for established portfolios.
Major Market Indicators
Source: Morningstar, Trading Economics, Reserve Bank of Australia
Market Expectations of Future RBA Cash Rates
The RBA hiked early May has no more than 1 more increase priced in for 2026:
30 June Market Valuations – Price to Cash Earnings
- With the war in Iran and the supply of oil through the Strait of Hormuz unresolved, energy driven inflation bothering Central Banks who are shifting to a rate rising stance globally and tremendous uncertainty around the likely impacts of the huge capital expenditure and usages of AI, one might reasonably expect equity prices to have fallen or, at least, moved sideways. Instead, they have boomed after a modest downturn in the first quarter of the year. This sort of counter-intuitive market behaviour is, in fact, quite normal. It is the reason why we take a long-term valuation based approached to asset allocation rather than trying to pick these short-term twists and turns. While we are avid students of all things economic and geopolitical, they pay very little role in our regular, long-term, decision-making.
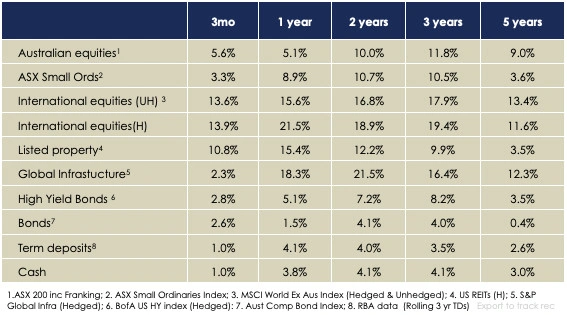
- As we see in Figure 1 below, Australian equities were up a cracking 5.6% for the quarter. Cracking until we see that international equities were up over 13% on both a hedged and unhedged basis. Listed property also had a strong quarter while Infrastructure, which has been the best performing asset over the past year, had a quieter quarter returning 2.3%.
- What we also see is that, if looked at through a longer-term perspective, returns over one, two, three and five years have been solid despite all the recent turmoil.
Figure 1: Performance (%pa) for periods ending 30 June 2026
Australian Equities
While over the year there has been substantial divergence in the performance of different sectors, with resources very strong and other sectors flat of down, over the quarter returns were modest and reasonable even across the sectors.
International Equities
A thumping quarter for international equities largely driven by the AI theme. Whether AI themed stocks continue to perform strongly over the remainder of the year and into next year is the subject of much debate in the investment community with strong views on both sides. We have no opinion either way on the short-term but note that, historically, very hot markets such as these can persist further than anyone thought likely and then profoundly disappoint. We expect this boom will be no different.
Real Assets: Real Estate Investment Trusts (Listed Property) and Infrastructure.
Real assets have had a fair quarter with strong performance from Global REITs (Real Estate Investment Trusts and a modest increase in) Infrastructure. Exactly the opposite to last quarter. Over the year, both have produced very strong returns.
Bonds
Bond returns were solid for the quarter and only modestly positive for the full year. The higher cash rates now, compared with one year ago, has been a drag for bond performance.
As discussed in the past, higher bond rates are bad news for current bond holders. This is because if, for example, we had bought a five-year bond at 4% and the current market yield for that bond increased to 5%, new buyers would not be prepared to pay 100 cents in the dollar for our 4% bond. In practice, they would pay closer to 95 cents in the dollar, with the 5% shortfall being used to make up for the 1% lower yield for five years. If our original investor holds to maturity, they will still receive their expected 4% return, but it will have come with some bumps along the way.
Going ahead we expect bond rates to gradually ease modestly boosting returns from bonds in the medium term to above their 4.7% yield.
Cash
From where we are today, the short-term outlook for cash rates remains unclear. The RBA again raised the cash rate in May and may have another rate increase in store. So far, the RBA has indicated that they would rather see a mild recession than inflation getting away from them, however that may change if we economic conditions turn south quickly.
Regardless of whether the next move is up or down, we continue to expect that the RBA will, over time, cut cash rates. We expect that they will probably be in the 3.25% to 3.75% range when this rate cycle is over.
The Long-Term Outlook for Returns
Forecasting short-term (1 to 4 years) returns is difficult and unlikely to lead to an improvement in outcomes for investors. While we need to understand what is happening in the world it is really only to helps us make a better assessment of long-term outcomes where we do believe sound decision-making can lead to better investment outcomes.
While the short-term outlook remains highly uncertain, the much longer term – five to ten years – can be more reliably forecast. As can be seen in Figure 2, the outlook for market returns going ahead is only fair and expected returns are much lower than the stellar experience of recent years.
Figure 2: Ten-Year Forecast Returns (%pa) as at 30 June 2026
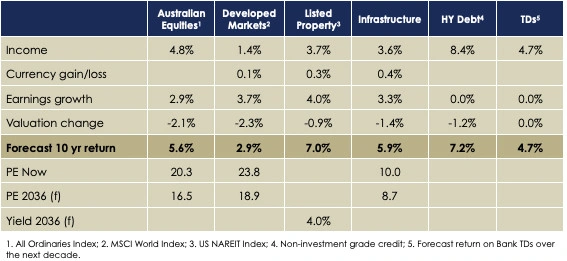
These forecasts for the next ten years are built up from assessing what we earn from dividends, how fast we expect company profits and property rents to grow and how much we expect future investors will pay for those profits and rents. While they are obviously based on estimates and are far from perfect, they generally come out within a few percent of the original estimate.
FIGURE 3: The Tipping Point Tables
Another way of looking at the forecasts is via the Tipping Point Tables which show whether different markets are Overpriced, Cheap or somewhere in between.
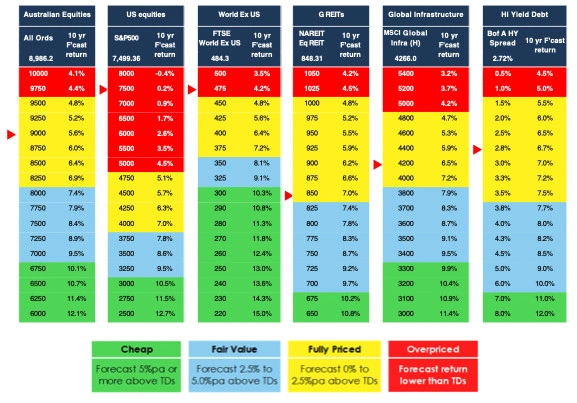
In the Red Zone of the Tipping Point Table the expected returns are less than those from fixed interest and it is time to start heading for the exits. International Equity markets are currently rated as Overpriced and the Australian Equity Market, while in the Fully Priced Zone, is not too far away. The yellow Fully Priced zone is where we begin to consider taking some modest cautionary action.
Potential Portfolio Moves
We will continue to closely monitor portfolios with the two key themes being the amount of equity exposure against that of real assets and whether a further reduction in the overall level of risk is prudent given the stretched nature of valuations and the manifest risks in the world economy.
We are comfortable with the status of your investments in fixed interest markets and High Yield Debt.
Published:
Share


Resources
A wealth of knowledge
Latest News
-
Brisbane Property Slump: What It Means
 October 6, 2026
-
Christmas Party Tax 2026: What Businesses Should Know
October 6, 2026
-
Tax Time ATO Scams & The 31 October Deadline
September 29, 2026
-
Estate Planning in Australia: A Simple 4-Part Guide
September 29, 2026
-
RBA Rate Rise September 2026: What Investors Need to Know
September 22, 2026
-
Income Protection for FIFO Workers: 6 Things to Check
September 22, 2026

Tools & Guides
Useful tools & guides to get you started
 Find out more

Video Guides
Useful videos to get you started
Find out more

Financial Calculators
See what impact little changes can have
Find out more